TL;DR
I give a high-level description and discussion of the projects in this portfolio that deal with the analysis of the EU industry production dataset, from finding the data to possible next steps.
Long Description
In this report, I cover all the way from identifying a dataset on the EU countries’ industry production development in the EU Open Data Portal to interpreting the results that I extract. I connect the single projects that form the entire data science process and show the highlights and issues of the study.
For the storage and analysis of the labeled time-series dataset I use PostgreSQL and the Anaconda distribution of Python packages, including Jupyter Notebook for writing and executing the code.
The industry production index time series, covering the years 2000–2017, turns out to be mostly linearly increasing or decreasing on long time scales. A linear regression thus provides a good estimate of the slope for each country, which summarizes the growth dynamics in one number. In a ranking ordered by the slope, the countries are clustered conspicuously clearly by geographical position: Eastern European EU member states perform particularly well, Southern European countries particularly badly.
A next step could answer the question if the Eastern European countries are merely catching up by also taking the absolute production values into account.
Table of contents
Goal
The goal of this end-to-end project is to show how Python and SQL can be used to manage and analyze a time-series dataset, demonstrating how useful information can be uncovered from the data and how to learn along the way. In the following, I provide an overview of these activities — for more information on a single project / data science step, please follow the links at the end of each section.
To obtain the dataset to tackle, I make use of the EU Open Data Portal.
The EU Open Data Portal
The EU Open Data Portal is a service that bundles access to online data repositories of EU institutions, e.g. the European statistics office Eurostat, and offices of the member states. The topics that are covered reach from economics and social questions to science and the environment.
The portal thus provides a good starting point for choosing datasets to work with.
Data selection
Industry production index
I decide to work with a dataset that contains the industry production index, an economic indicator that can be used to compare the growth dynamics of the European countries.
More specifically, I select the industry production index for the manufacturing branch (in the EU classification system this is letter “C”, which does not include, among others, the mining and energy branches).
Data download
For reproducibility reasons, I choose to use the API (Application Programming Interface) to obtain the dataset. However, it turns out that it only provides a (rather cryptically structured) catalog of the metadata and download links that lead to files containing the full datasets.
The download process is complicated by a bug in the file decompression that is provided by the website. After overcoming this by using pandas for the decompression, I store the entire dataset in a local PostgreSQL database and then extract the manufacturing branch data.
Links to projects
- Automated data retrieval from an online repository to harness free data sources
- Storing a pandas dataframe in a PostgreSQL database
- Using SQL queries to extract data from a PostgreSQL database
Wrangling
Tidying up the dataframe
Next I scan the structure of the (sub-)dataset and identify the columns, rows and values in the online documentation. The latter fights fiercely for its secrets, but is forced to release them after some research.
With this new knowledge, I restructure the dataframe and index by time and country code. Furthermore, I clean the production index values by removing flag letters and turning them into proper float values.
Links to projects
- Bringing an EU industry production dataframe into good shape
- Making the numbers shine: Cleaning EU industry production index values
First analysis and modeling
Exploratory data analysis
Exploratory data analysis (EDA) on the cleaned dataframe with pandas statistical methods and matplotlib line plots reveals long-term growth for most of the countries, short-term fluctuations and additional mid-scale features like a dip in 2008 that coincides with the beginning of the financial crisis:
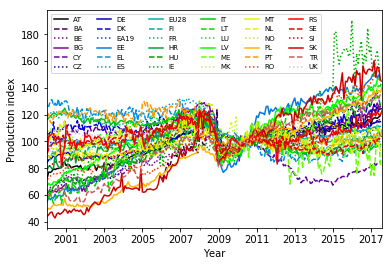
A table that relates the country codes to the country names can be found here.
Note that data for the vast majority of countries is only available for 2000 and later, although the dataset begins in 1953. I thus concentrate in my study on the 21st century.
Normalizing the time series
To get rid of the common trends and bring out the individual long-term of the countries, I divide each time series by the EU-averaged (EU28) time series:
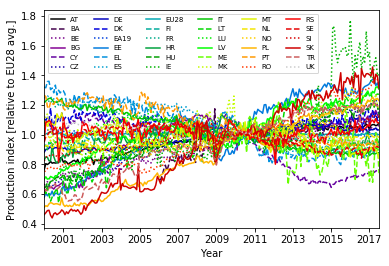
Linear model
The normalized time series are roughly linear, which motivates to use linear regression to obtain the slopes of each country as a measure of growth. For illustrative purposes, I use the package scikit-learn for this task.
Links to projects
- Exploring the industry production history with EDA
- Removing common trends from a set of time series to highlight their differences
- Reducing complexity – from a time series to a single number: modeling
Extracting the growth trends
Two slope measures
I extract the slopes both using linear regression and as a simple difference between the production index values at the end and the beginning of the time series. This provides a rough estimate of the robustness of the slope values.
Visualization with bar charts
The slopes can be visualized with bar charts (blue: linear regression, orange: simple difference):
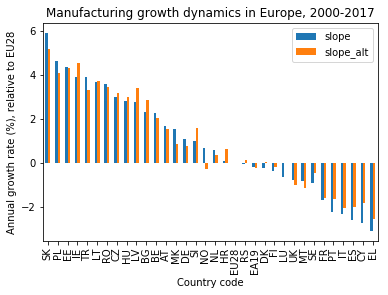
They are robust enough to allow distinguishing several groups. It turns out that geographical location is an important factor:
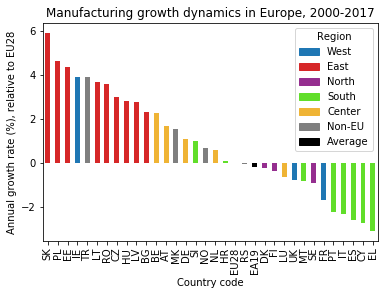
Interpretation
Eastern European countries, having joined the EU in 2004 or later, outperform the other countries, whereas Southern European countries perform much worse than average.
Since the dataset only contains relative numbers (index values with 2010 as the reference year) and I computed the slopes relative to the EU average, I cannot make statements about the absolute performance of the countries.
It is likely though that the fast growth rates of the Eastern European countries are part of a catch-up process that originated in the economic and political transformation 1989/90.
Links to projects
- Reducing complexity – from a time series to a single number: coding
- Different countries’ growth dynamics at a glance with bar charts
- Spotting trends in the manufacturing growth dynamics: Which region grew the fastest?
Next steps
Absolute production value
To understand if the fastest-growing countries are hurrying from the others or merely catching up, a comparison of the absolute production value would be a possible next step.
Since the data that I have analyzed so far is only relative (production index), this requires additional datasets, e.g., the “annual detailed enterprise statistics for industry” dataset, which is also availabe in the EU Open Data Portal.
Link to project
Documentation
Github repository
Apart from this summary, I have made the Jupyter notebooks that contain the Python code used for the data analysis available on Github.
Link to project
Conclusion
I have successfully obtained the EU industry production dataset from the EU Open Data Portal, downloaded and stored its contents, understood its structure, cleaned and reorganized the data, visualized and modeled it, extracted key insights, proposed next steps and documented the code I used.
The industry production index, as an indicator for economic development, showed a roughly linear increase for most countries in the years 2000–2017, briefly interrupted by a sudden dip in 2008 when the financial crisis emerged. It turned out that the industry production in the Eastern European member countries grew between 2 to 6 percent faster per year than the EU average, whereas most Southern European countries fell behind by 2 to 4 percent per year. Other EU countries grew similarly to the EU average, within a +/-2 percent corridor, except for the fast-growing industry in Ireland (4 percent above average). These results could be accompanied by the absolute industry production values as a possible next step.
Along the way, I gained experience working with Jupyter Notebook, found out about bugs in pandas, an arcane data documentation and other practical issues that I had to overcome.
Bio
I am a data scientist with a background in solar physics, with a long experience of turning complex data into valuable insights. Originally coming from Matlab, I now use the Python stack to solve problems.
Contact details
Jan Langfellner
contact@jan-langfellner.de
linkedin.com/in/jan-langfellner/